According to recent CoreLogic research, the national Home Value Index (HVI) rose by 8.91 TWh over the past 12 months, increasing the national median home value by approximately A$63,000 to A$765,762, reaching a record high in February. CoreLogic economist Kaytlin Ezzy analyzed 4,625 house and unit markets across Australia from a regional perspective, finding that nearly 90% (88.41 TWh, or 4,087 units) saw an increase in value over the past year. This suggests that price increases are more widespread than the 52.91 TWh in July 2023 and 39.11 TWh in February 2023. Brisbane saw 1,001 TWh of these areas experience price increases, the highest rate among major Australian cities.
Ms. Ezzy said the broad-based house price increases seen over the past year reflected a persistent imbalance between housing supply and demand. An entrenched shortage of housing stock, coupled with above-average demand driven by strong immigration levels, helped push up house prices, despite three interest rate hikes through 2023, worsening affordability and rising living costs.
Brisbane leads the way in property price growth
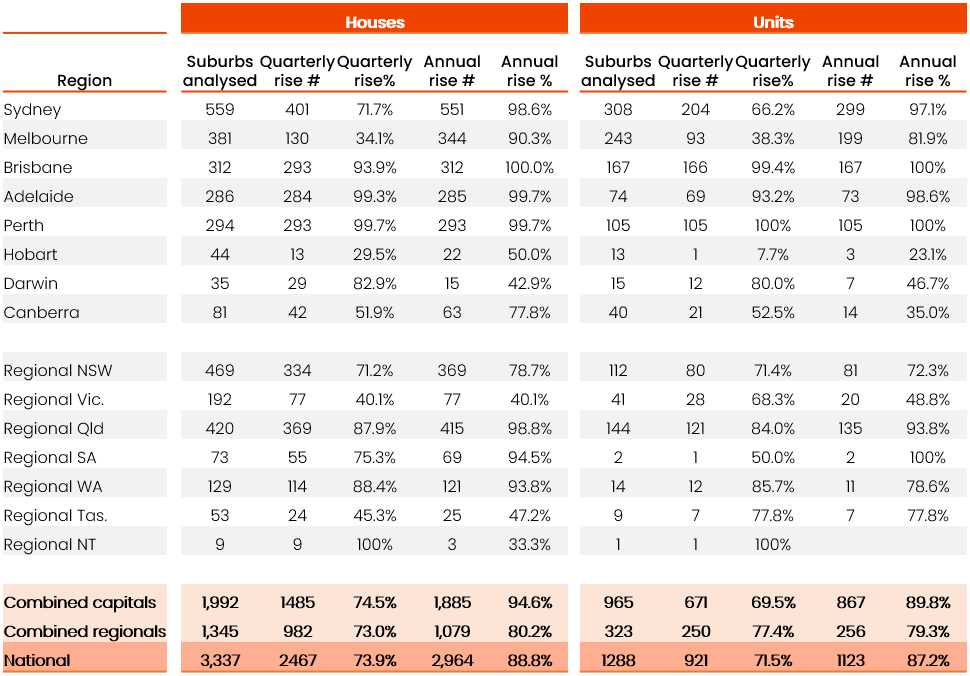
Brisbane, Adelaide, and Perth saw the broadest value growth over the past year for both houses and units. All 312 building markets and 167 unit markets in Brisbane saw an increase in value over the past year. East Perth was the only western capital city market to record a decline in house values, while in Adelaide, only one building market (Black Forest) and one unit market (Glenalg South) saw a decrease in value over the year to February, falling by 0.4% and 1.8%, respectively. Domestic and foreign migration, a shortage of housing supply, and relatively low property prices in these cities all contributed to the broad-based growth in these markets.
Ezzy noted that the growth was also very strong, exceeding 10%. Perth's Waikiki coastal area saw annual unit growth of 42.11 TP3T. Brisbane led the way in terms of growth, with 1,001 TP3T of suburbs experiencing growth, and 86.41 TP3T of suburbs experiencing double-digit increases in both housing and unit values. The fastest-growing markets were concentrated in Brisbane's south, with the highest growth occurring in the inherently more accessible Logan-Beaudesert, Ipswich, and Moreton areas.
As for expensive markets such as Sydney and Melbourne, both saw some sway in the November rate hike, but quarterly growth showed a slight rebound. The quarterly growth trend in both cities improved, from 0.0% in Sydney and -0.9% in Melbourne (January 24), to 0.6% and -0.6% in February respectively.
"While growth was recorded across broad regions, the pace of growth diverged across the country – a trend that looks set to continue through 2024," Ezzy said.
House rents in 40% of regions saw double-digit growth
Nearly 401 TPP areas in the house and unit markets recorded double-digit rent increases. Of the 4,030 house and unit markets nationwide, 94.21 TPP areas saw rent increases, with nearly 401 TPP areas seeing rent increases of 101 TPP or more. From a low of 8.11 TPP in October, annual rent values have rebounded in recent months, reaching 8.51 TPP in February, driven in part by a recent acceleration in rent increases in major cities.
"Over the past few years, rental growth has favored apartments in major cities," Ms. Ezzy said. "But as apartment rents become increasingly unaffordable, some potential tenants may turn to renting, sharing the cost of rent, or even moving to more distant, more affordable areas."